Changelog
Follow up on the latest improvements and updates.
RSS
This month we are releasing a new Live Debug mode and a few dashboard bug fixes. You can now view live sensor data directly in the Debug panel, making it easier to track device connectivity and data flow in one streamlined interface.
Key Highlights:
- Real-Time Sensor Data: Instantly see live events such as connection status and sensor readings displayed in a user-friendly format.
- Detailed Data Preview: Inspect payloads with an interactive JSON view, including critical information like timestamp, device serial, and sensor-specific data like luminosity.
- Connection Tracking: Monitor your devices’ connection status in real time, so you’re always in the know about whether your devices are online or offline.
- Event Topic Display: Quickly identify the event source with clear topic annotations for each debug event.
- Streamlined Interface: The Debug tab now features an organized view, so you can track multiple events efficiently without overwhelming your workspace.
This feature is designed to give you full visibility into your devices, making debugging faster and easier. Whether you’re working with connections or data, you’ll now have the tools you need to ensure your devices are running smoothly.

Lots of exciting changes and new features in the latest Zafron release.
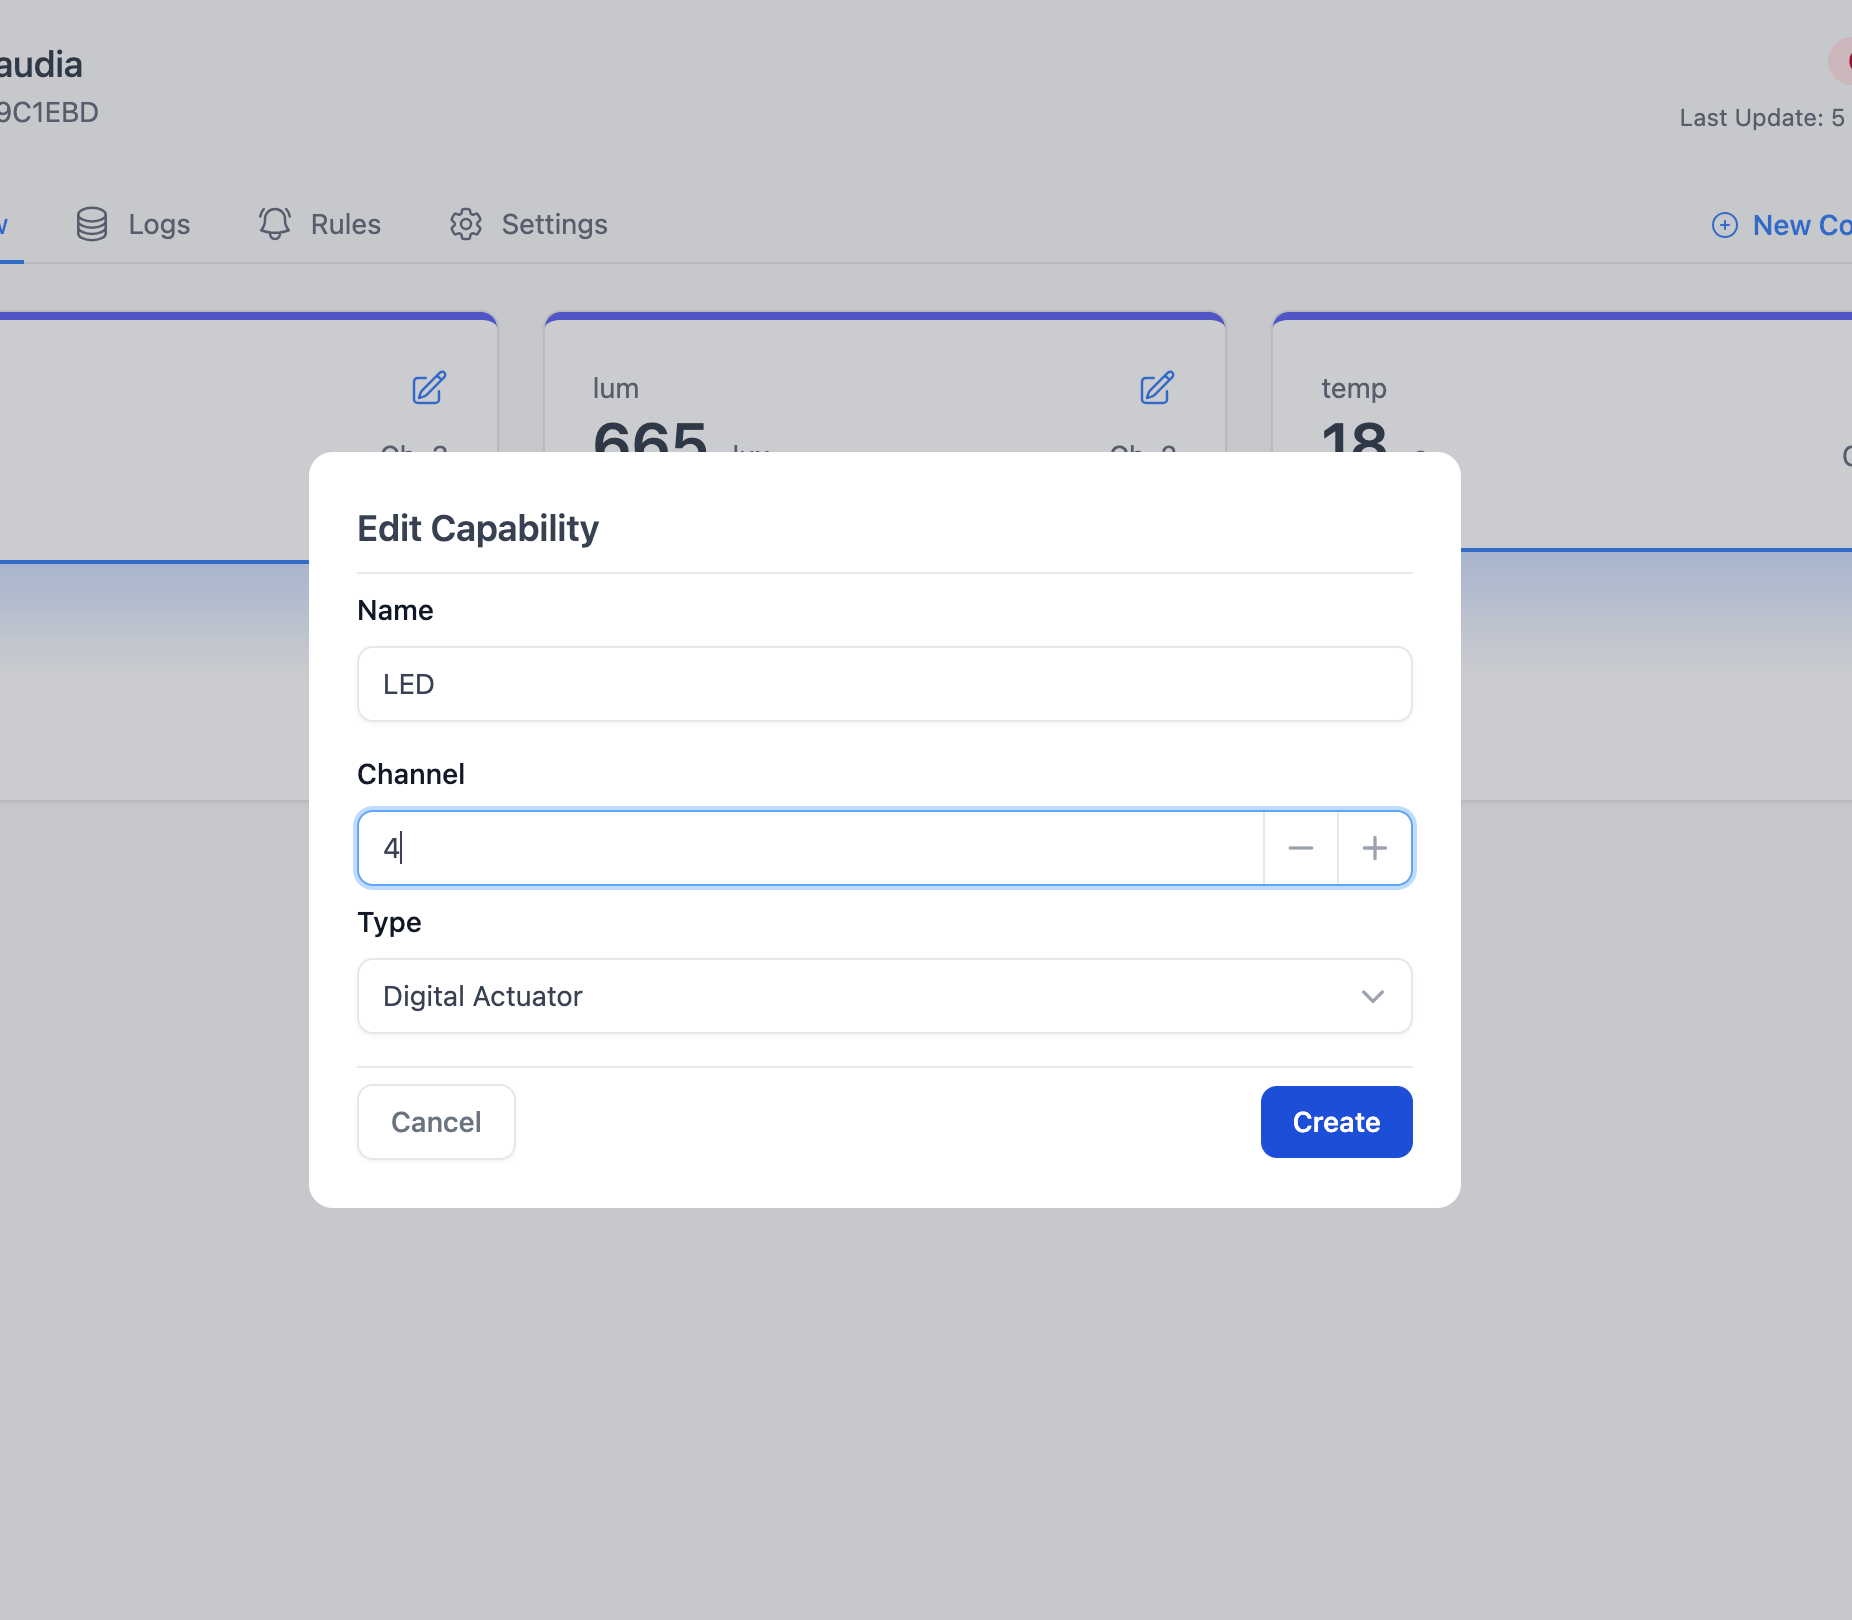
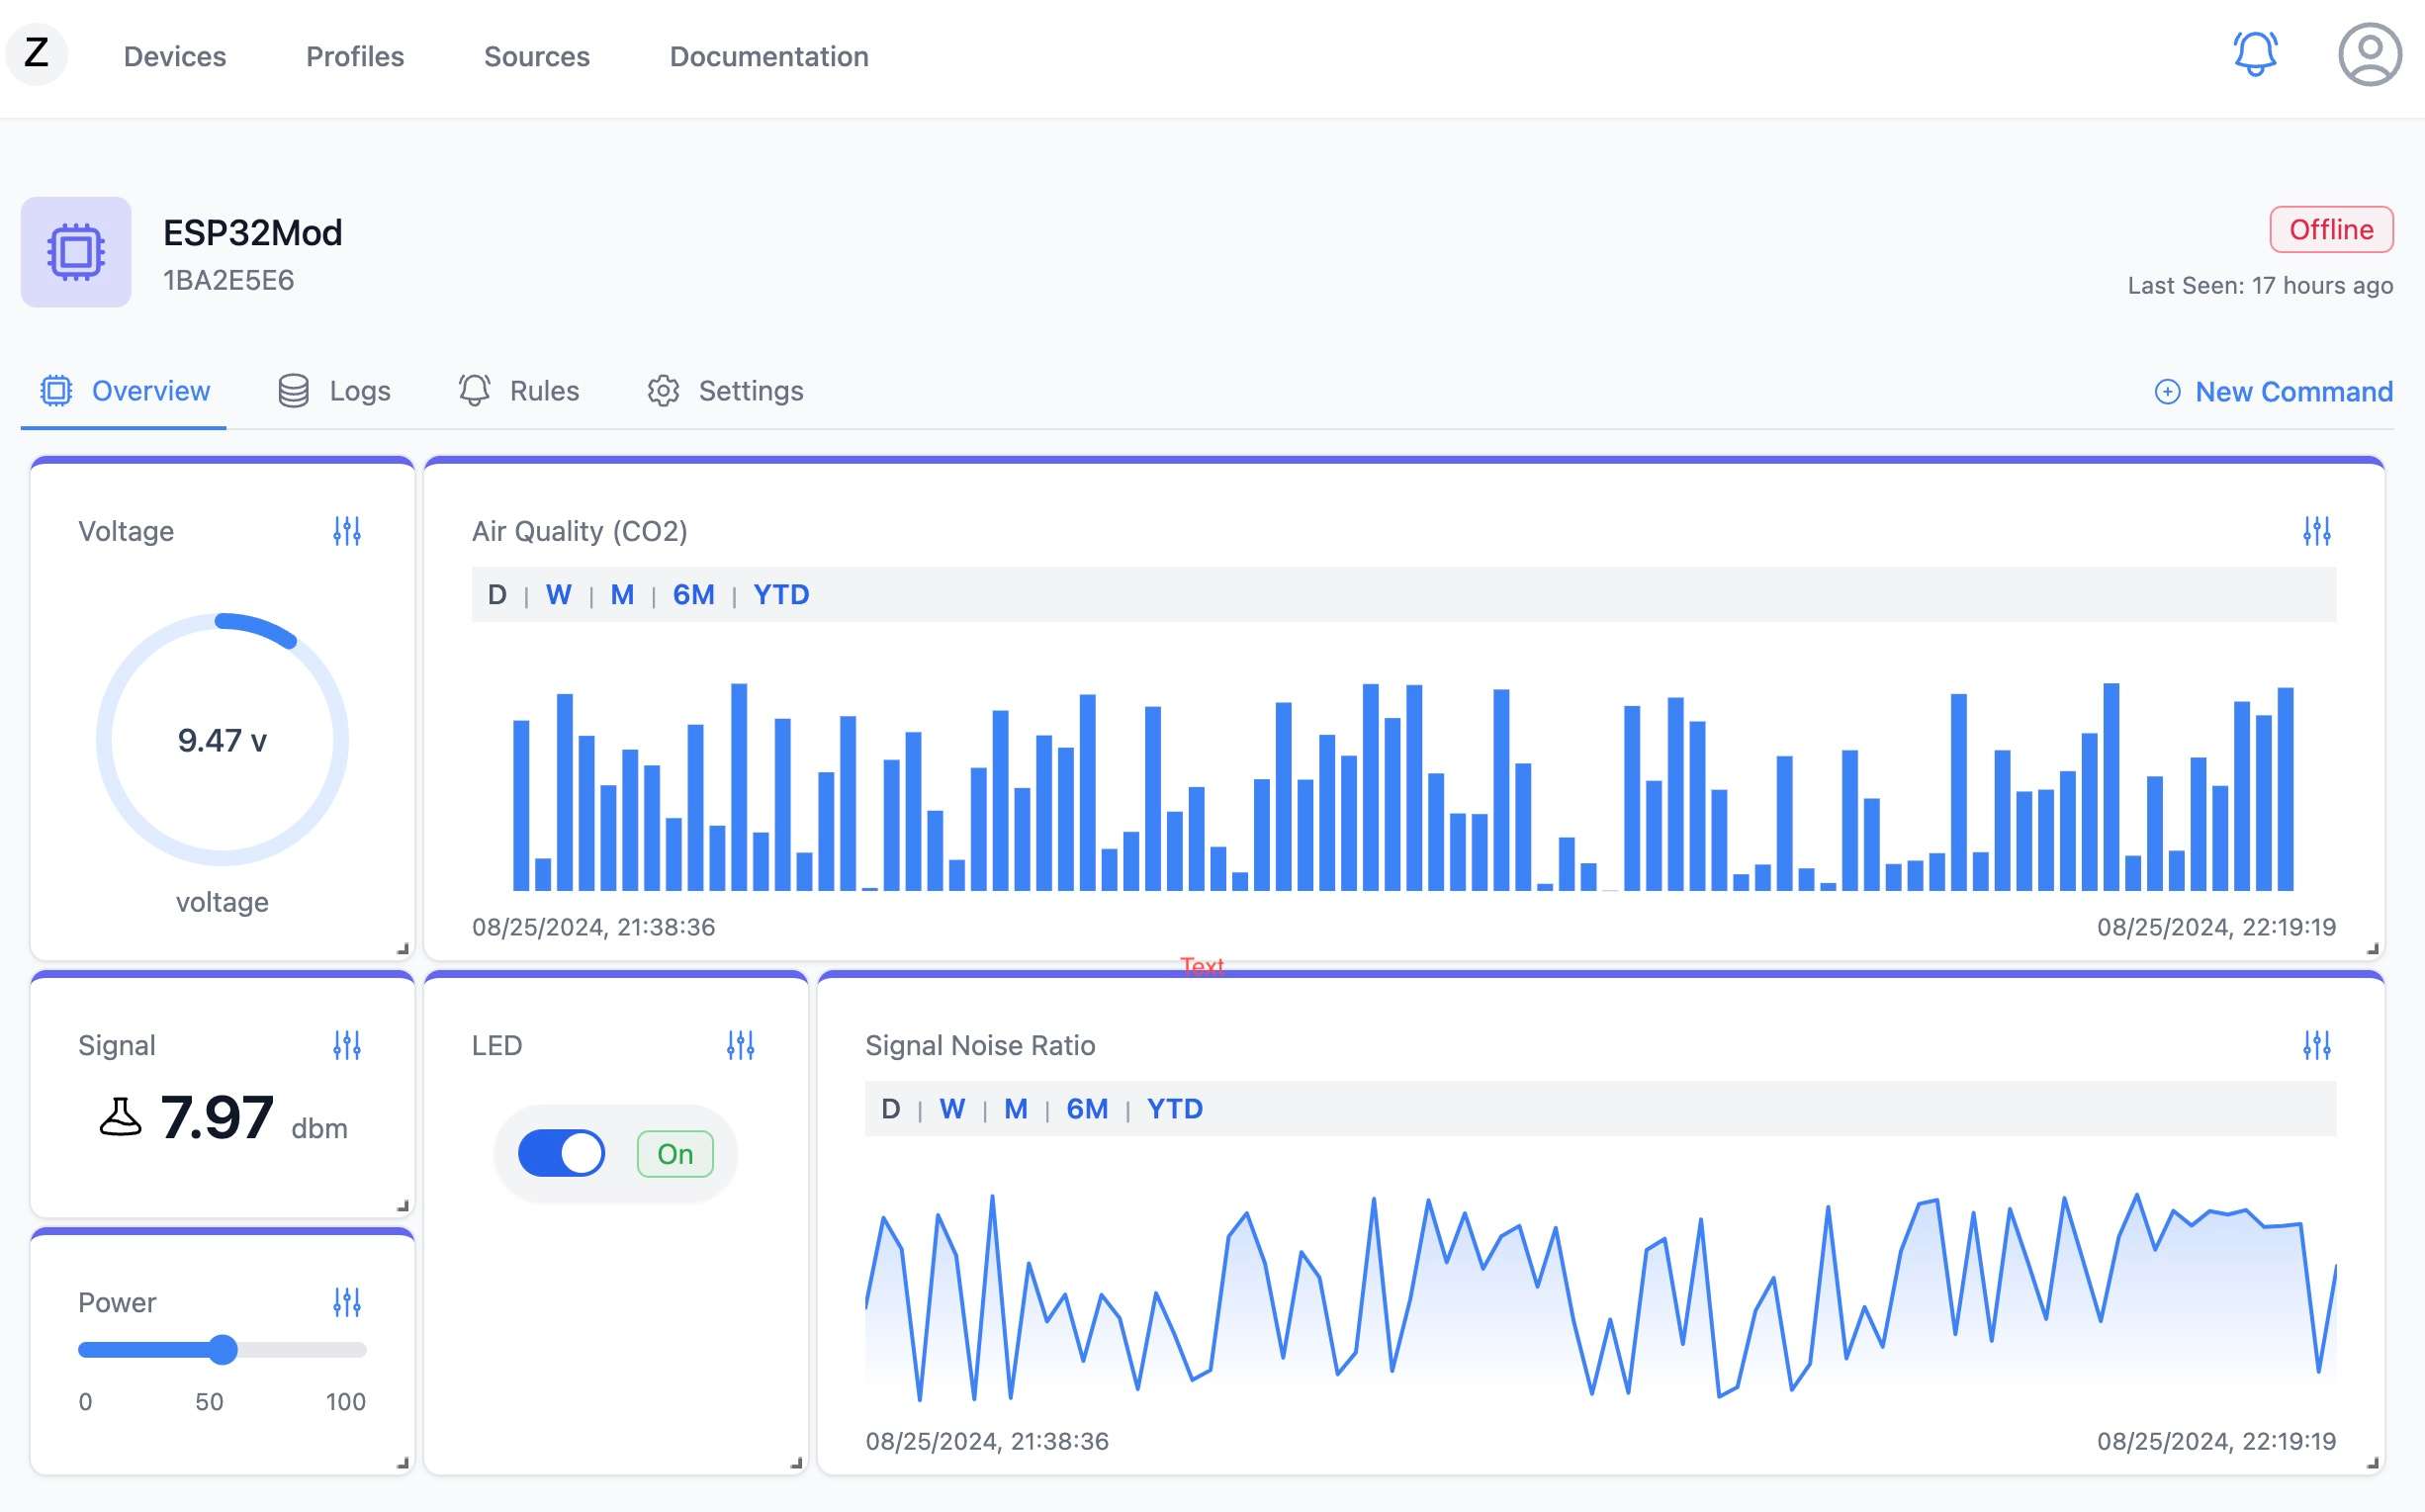
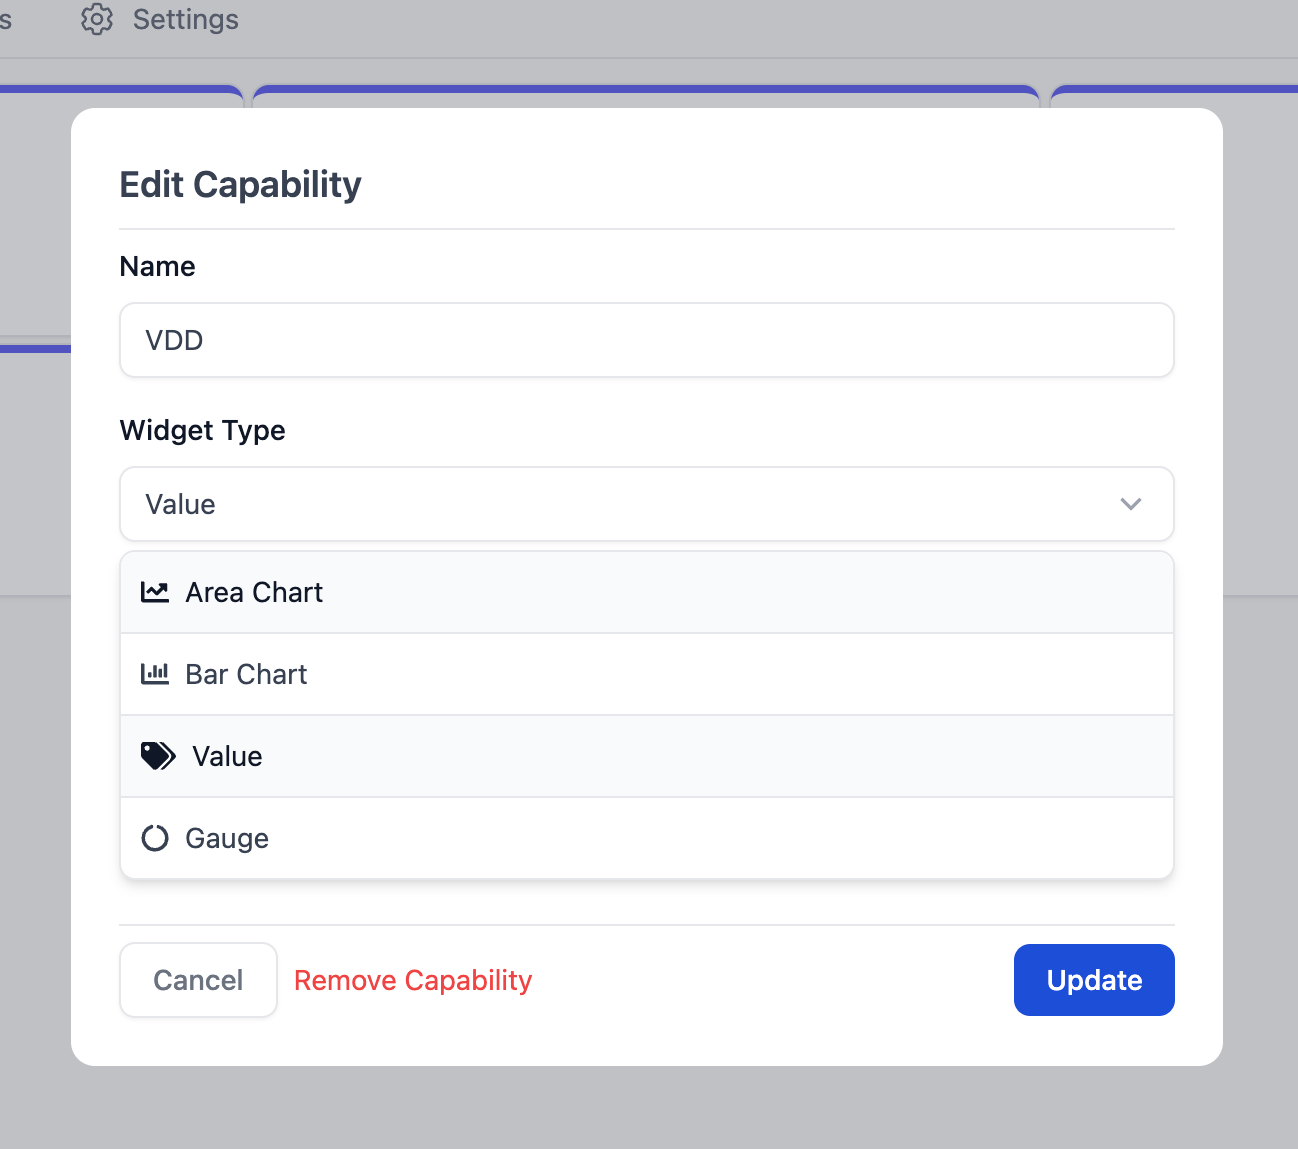
- New Widgets (BarChart, Gauge, Value and Slider (Analog Actuator))
- Resize Widgets
- Rearrange Widgets
- Bar Chart and Area Chart date filtering
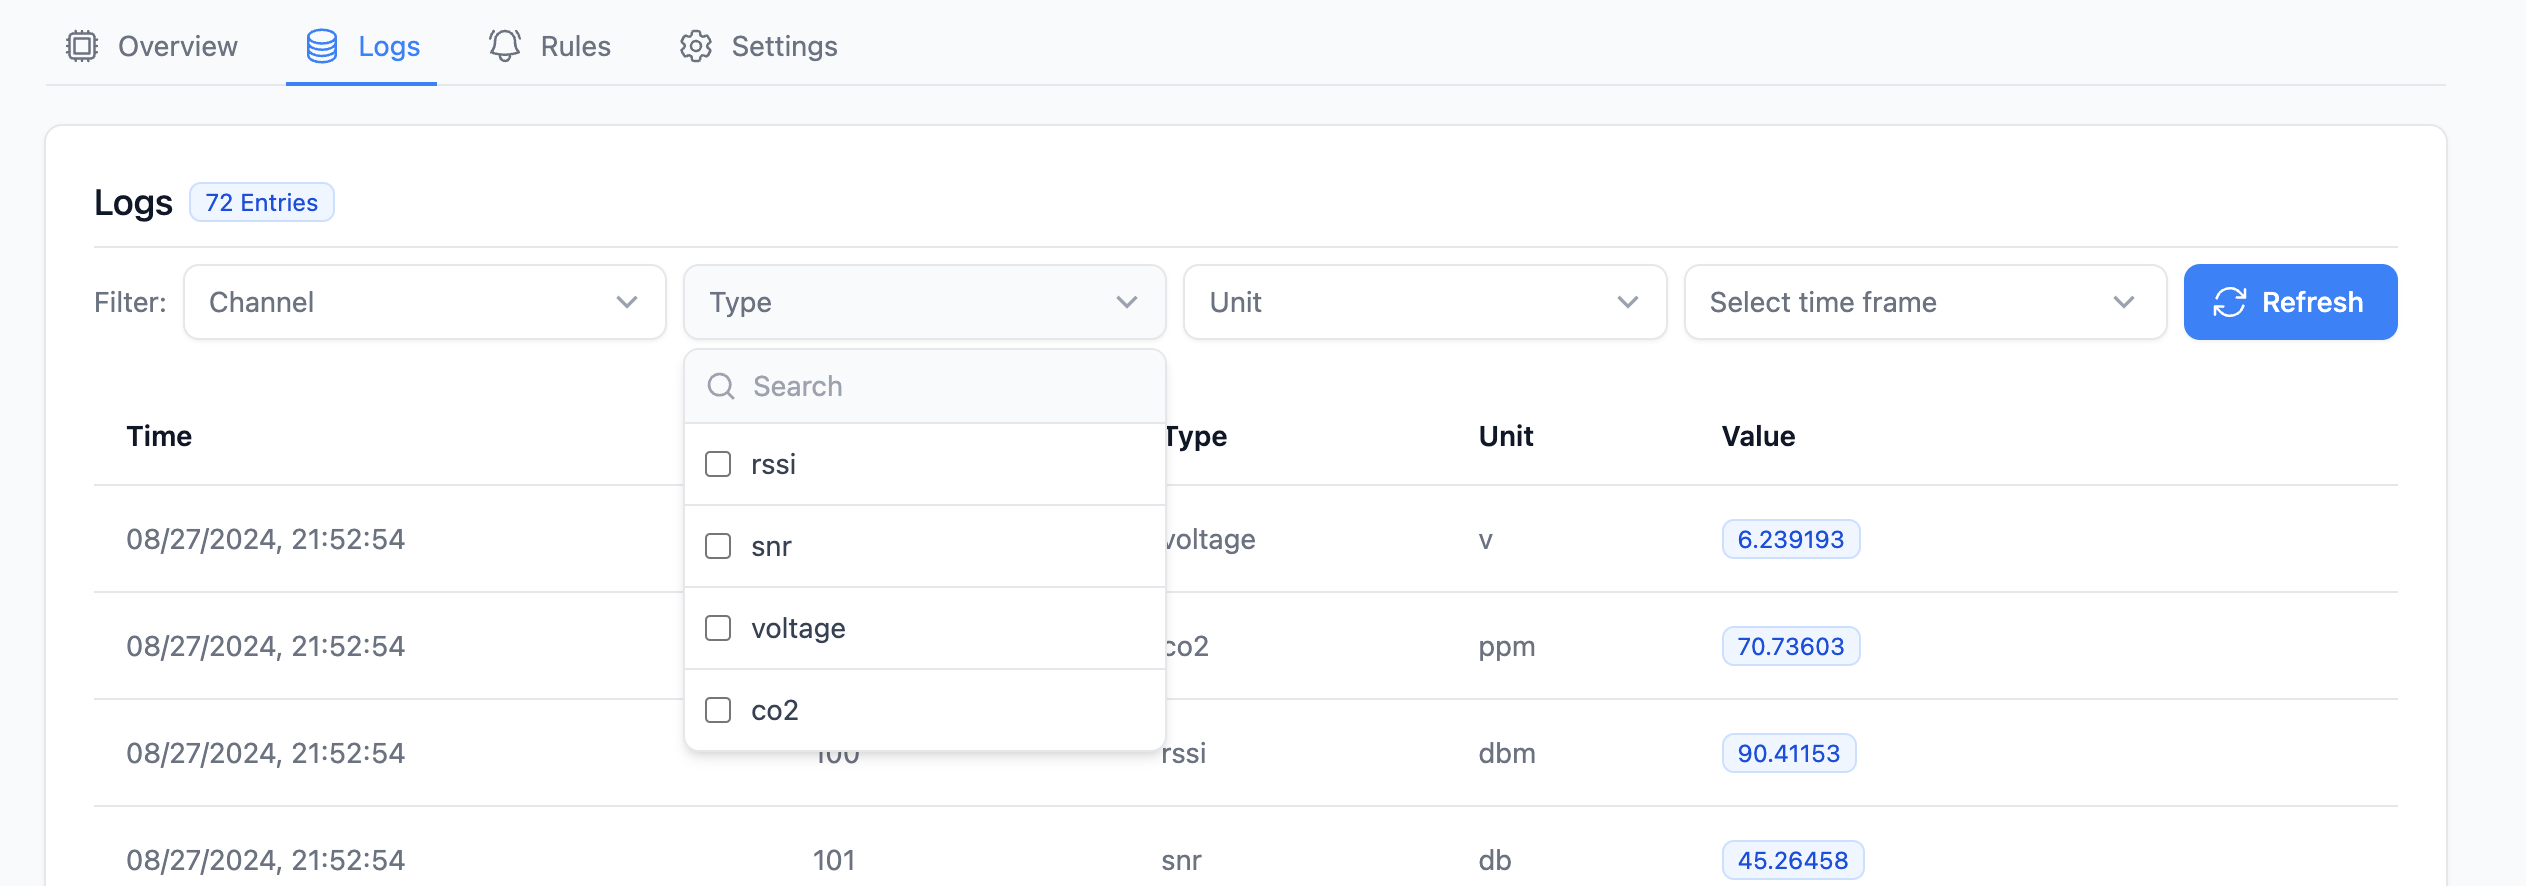
- Logs filtering
- Account Settings and Usage
- Various UI enhancements and fixes
Widget Type Selection
Logs Filtering
If you have any issues, please reach out.
Exciting release, Zafron now support LoRaWAN devices and HTTP inbound data.
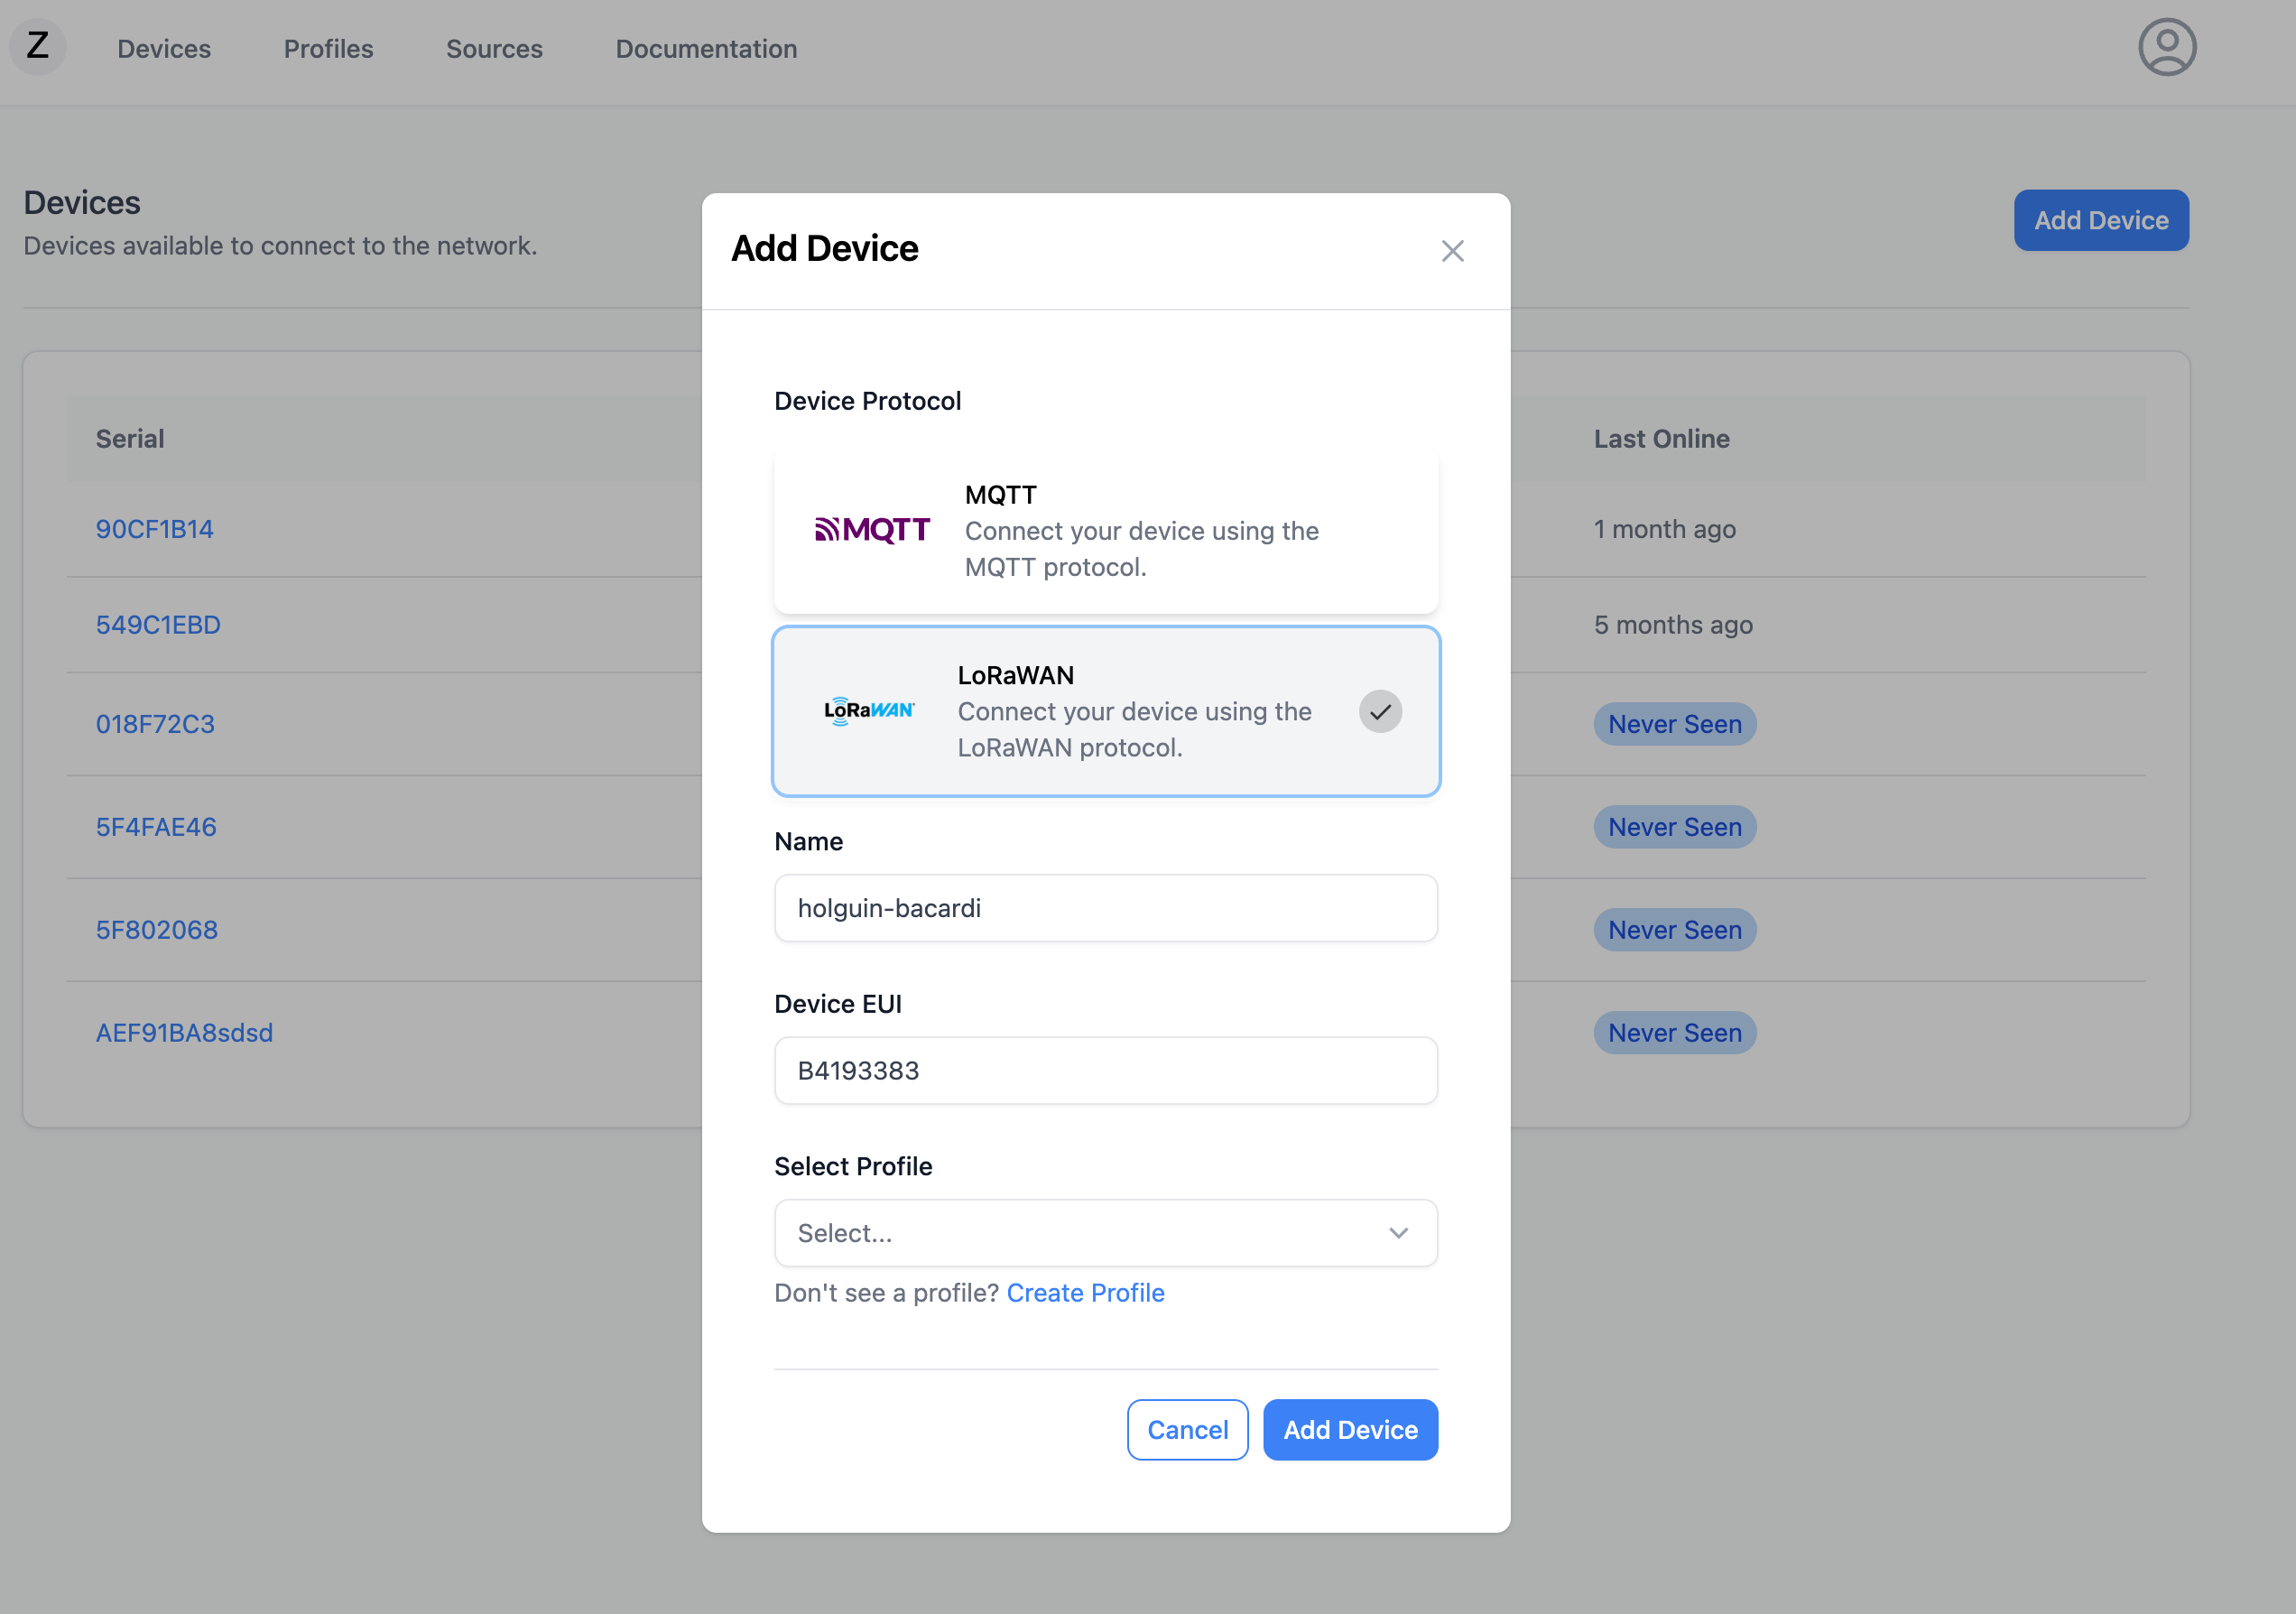
This new feature opens the door to a whole new ecosystem of devices and LoRa network server support. In this release, we also introduce HTTP inbound device data making it possible to receive IoT data via HTTP.
We also introduced the concept of Device Profiles. This is a preliminary abstraction layer that will be extend in the future. This layer will allow users to create Profiles that can be applied to end devices.
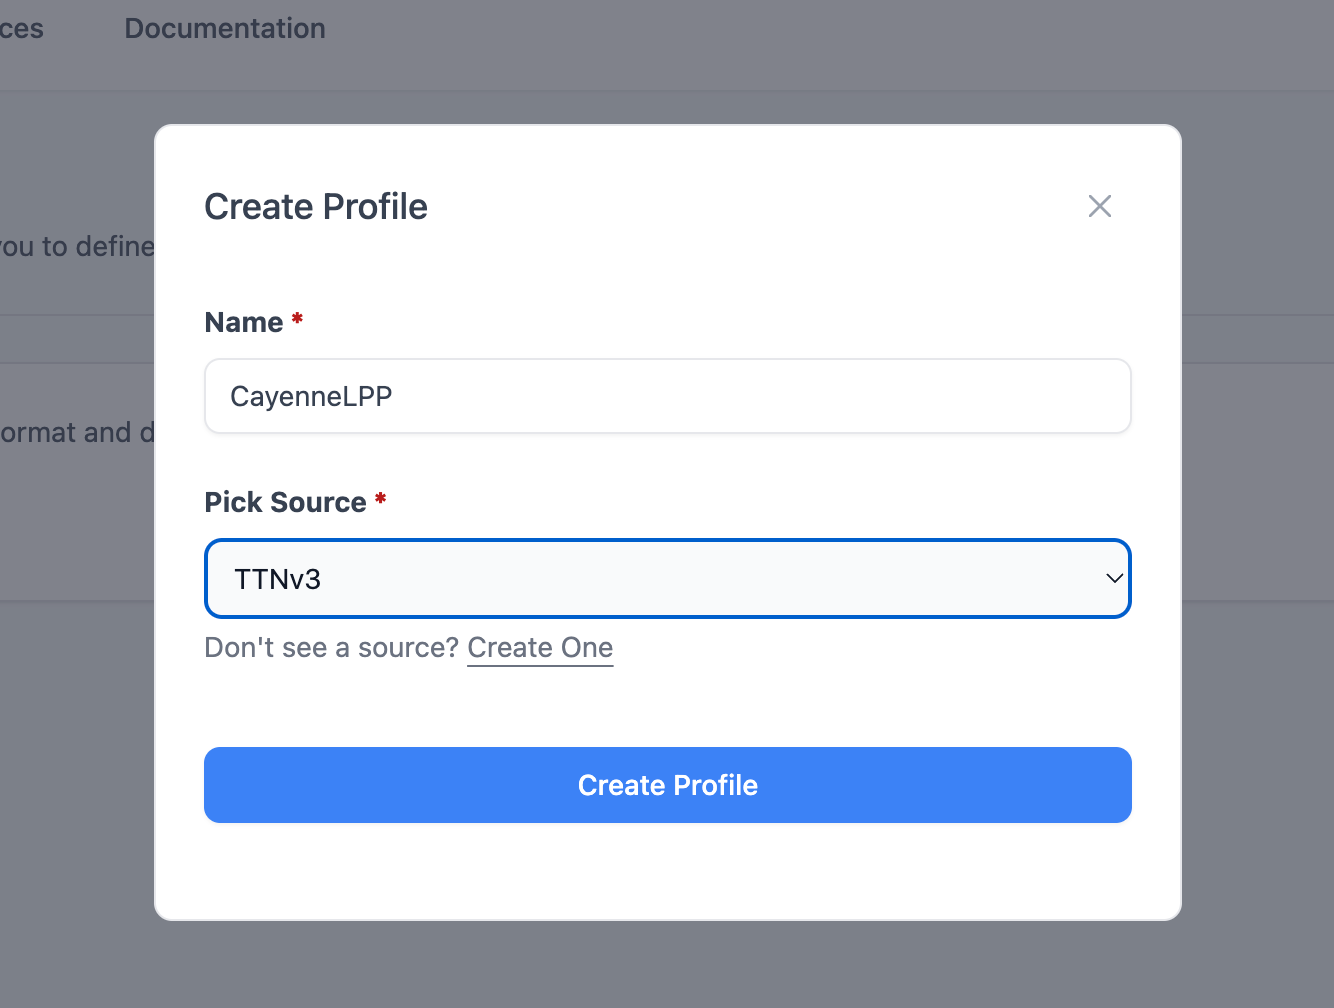
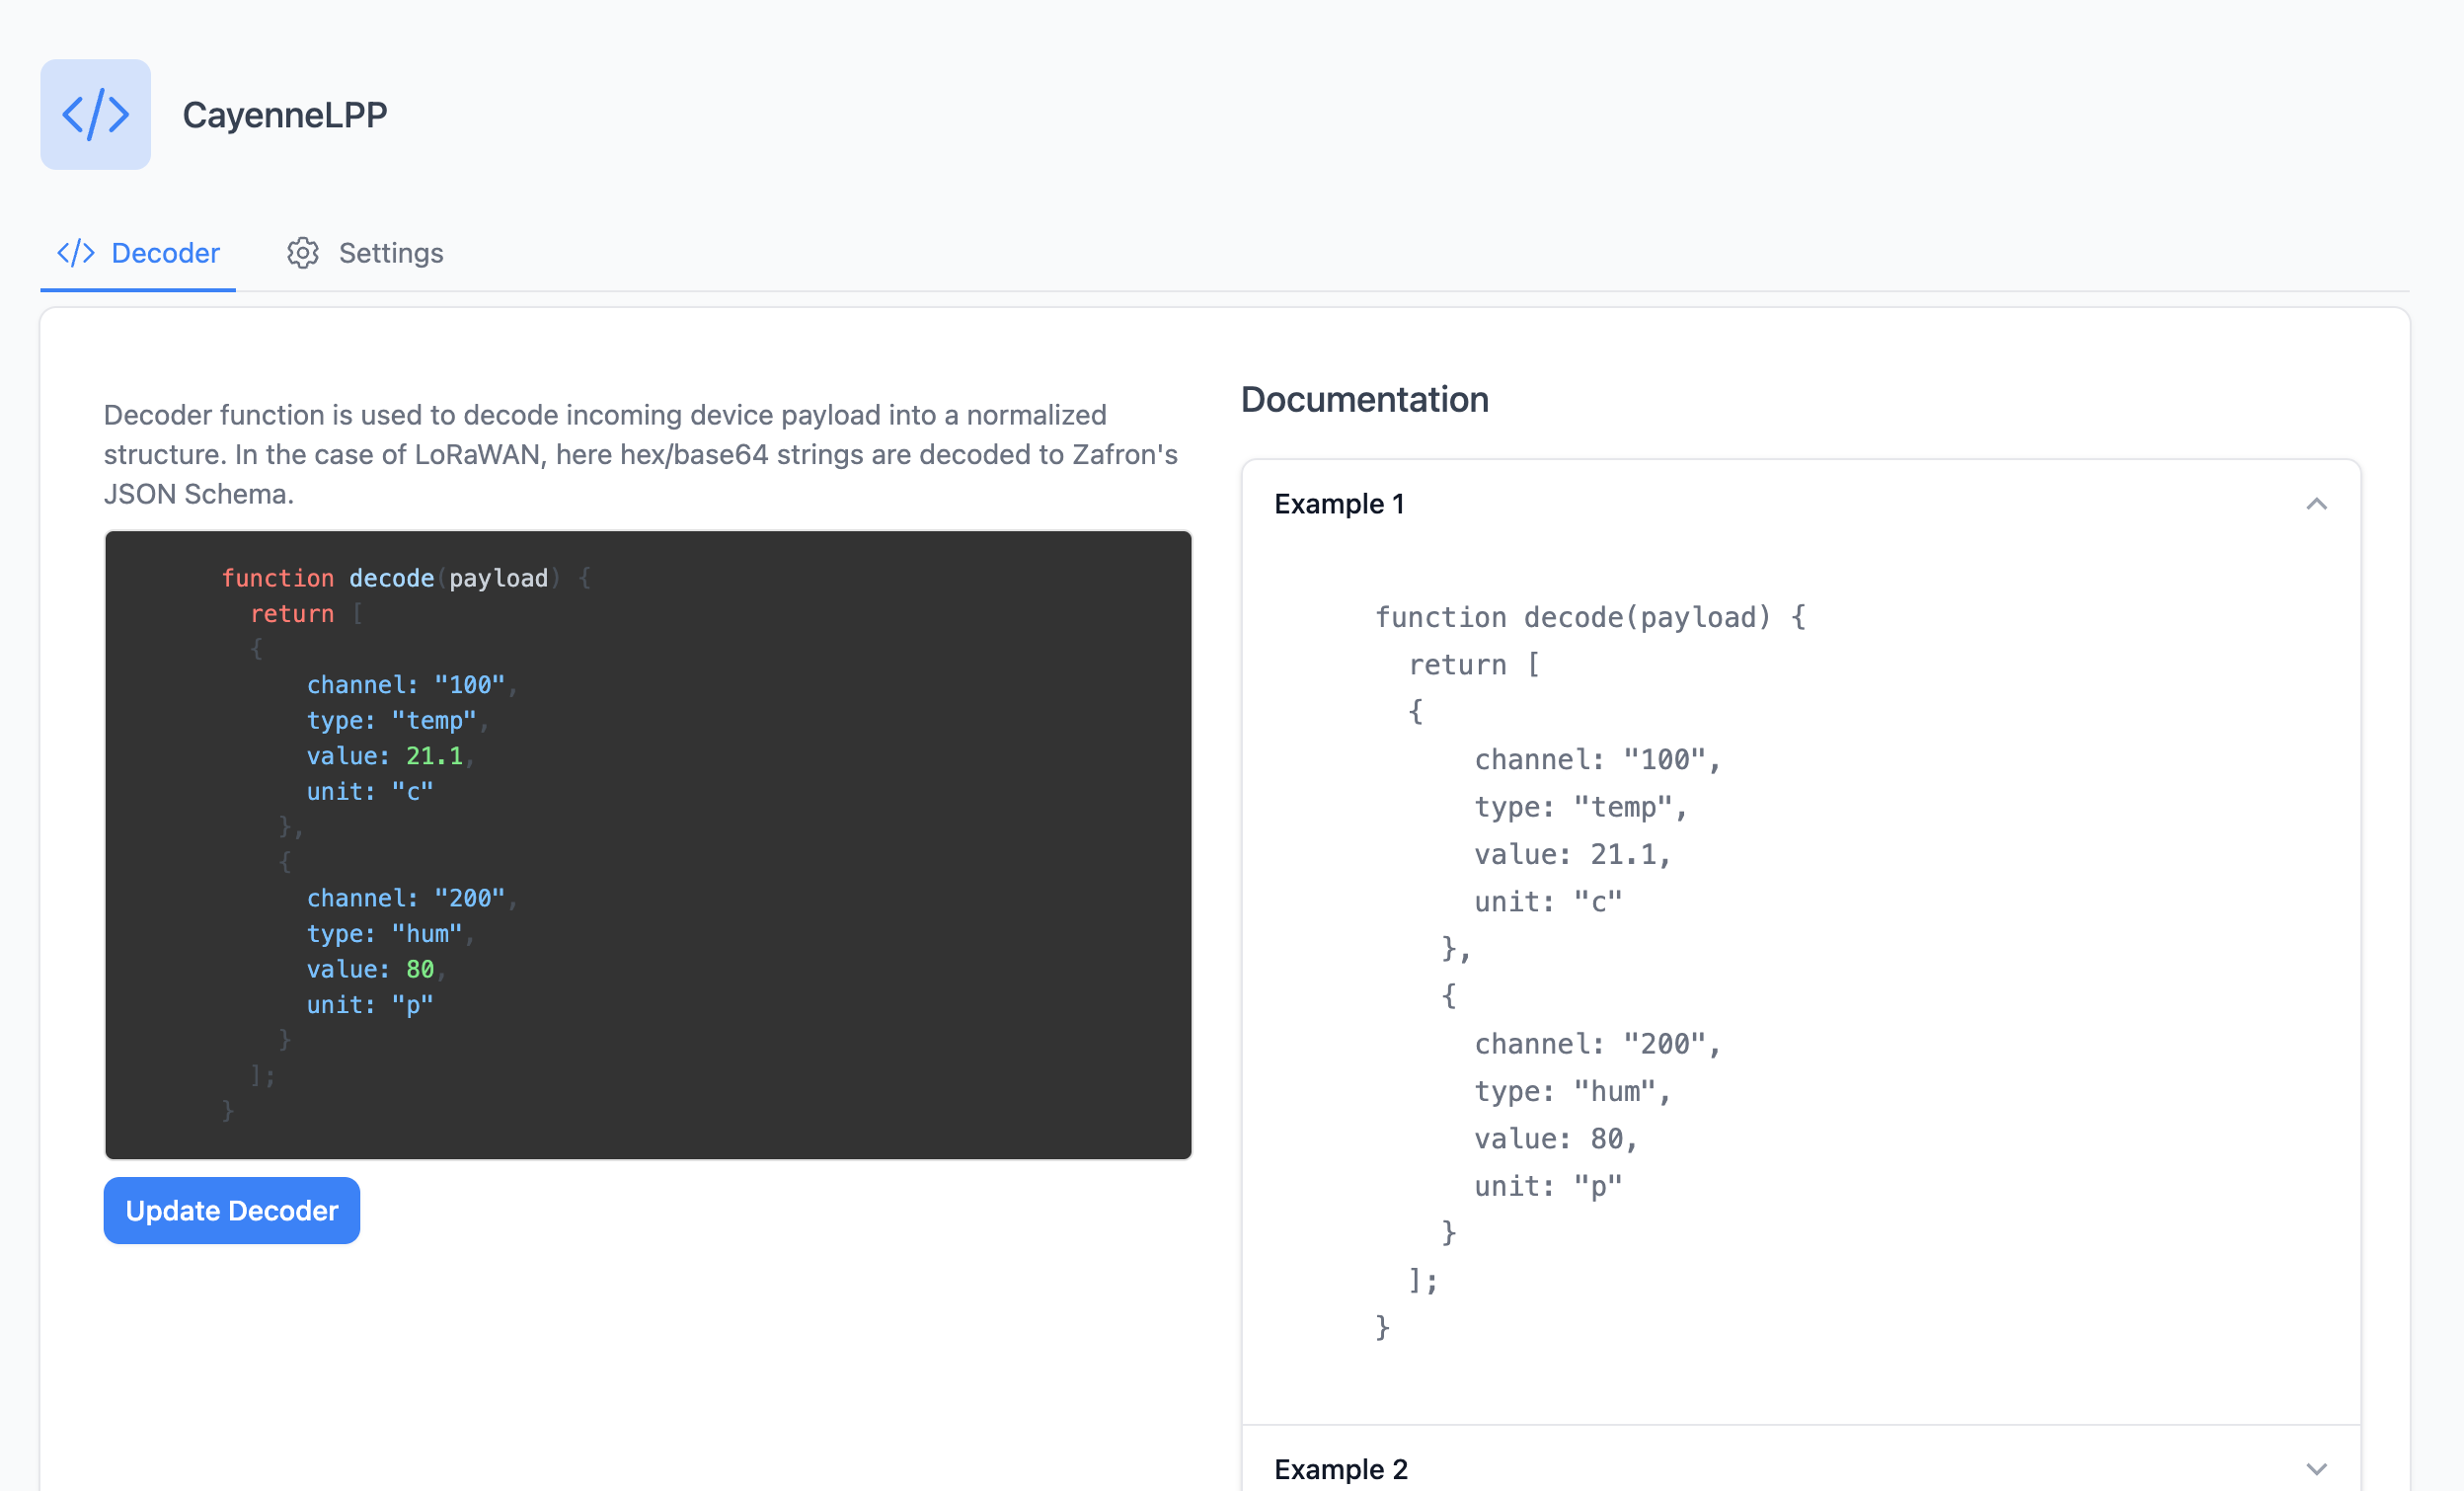
Additionally, Profiles offers decoders, which paves the way to decode data from sources and normalize it to Zafron's internal JSON structure.
This is a beta release, looking to see your projects come to life.
Reach out if you have feedback or questions!
The Zafron Team
new
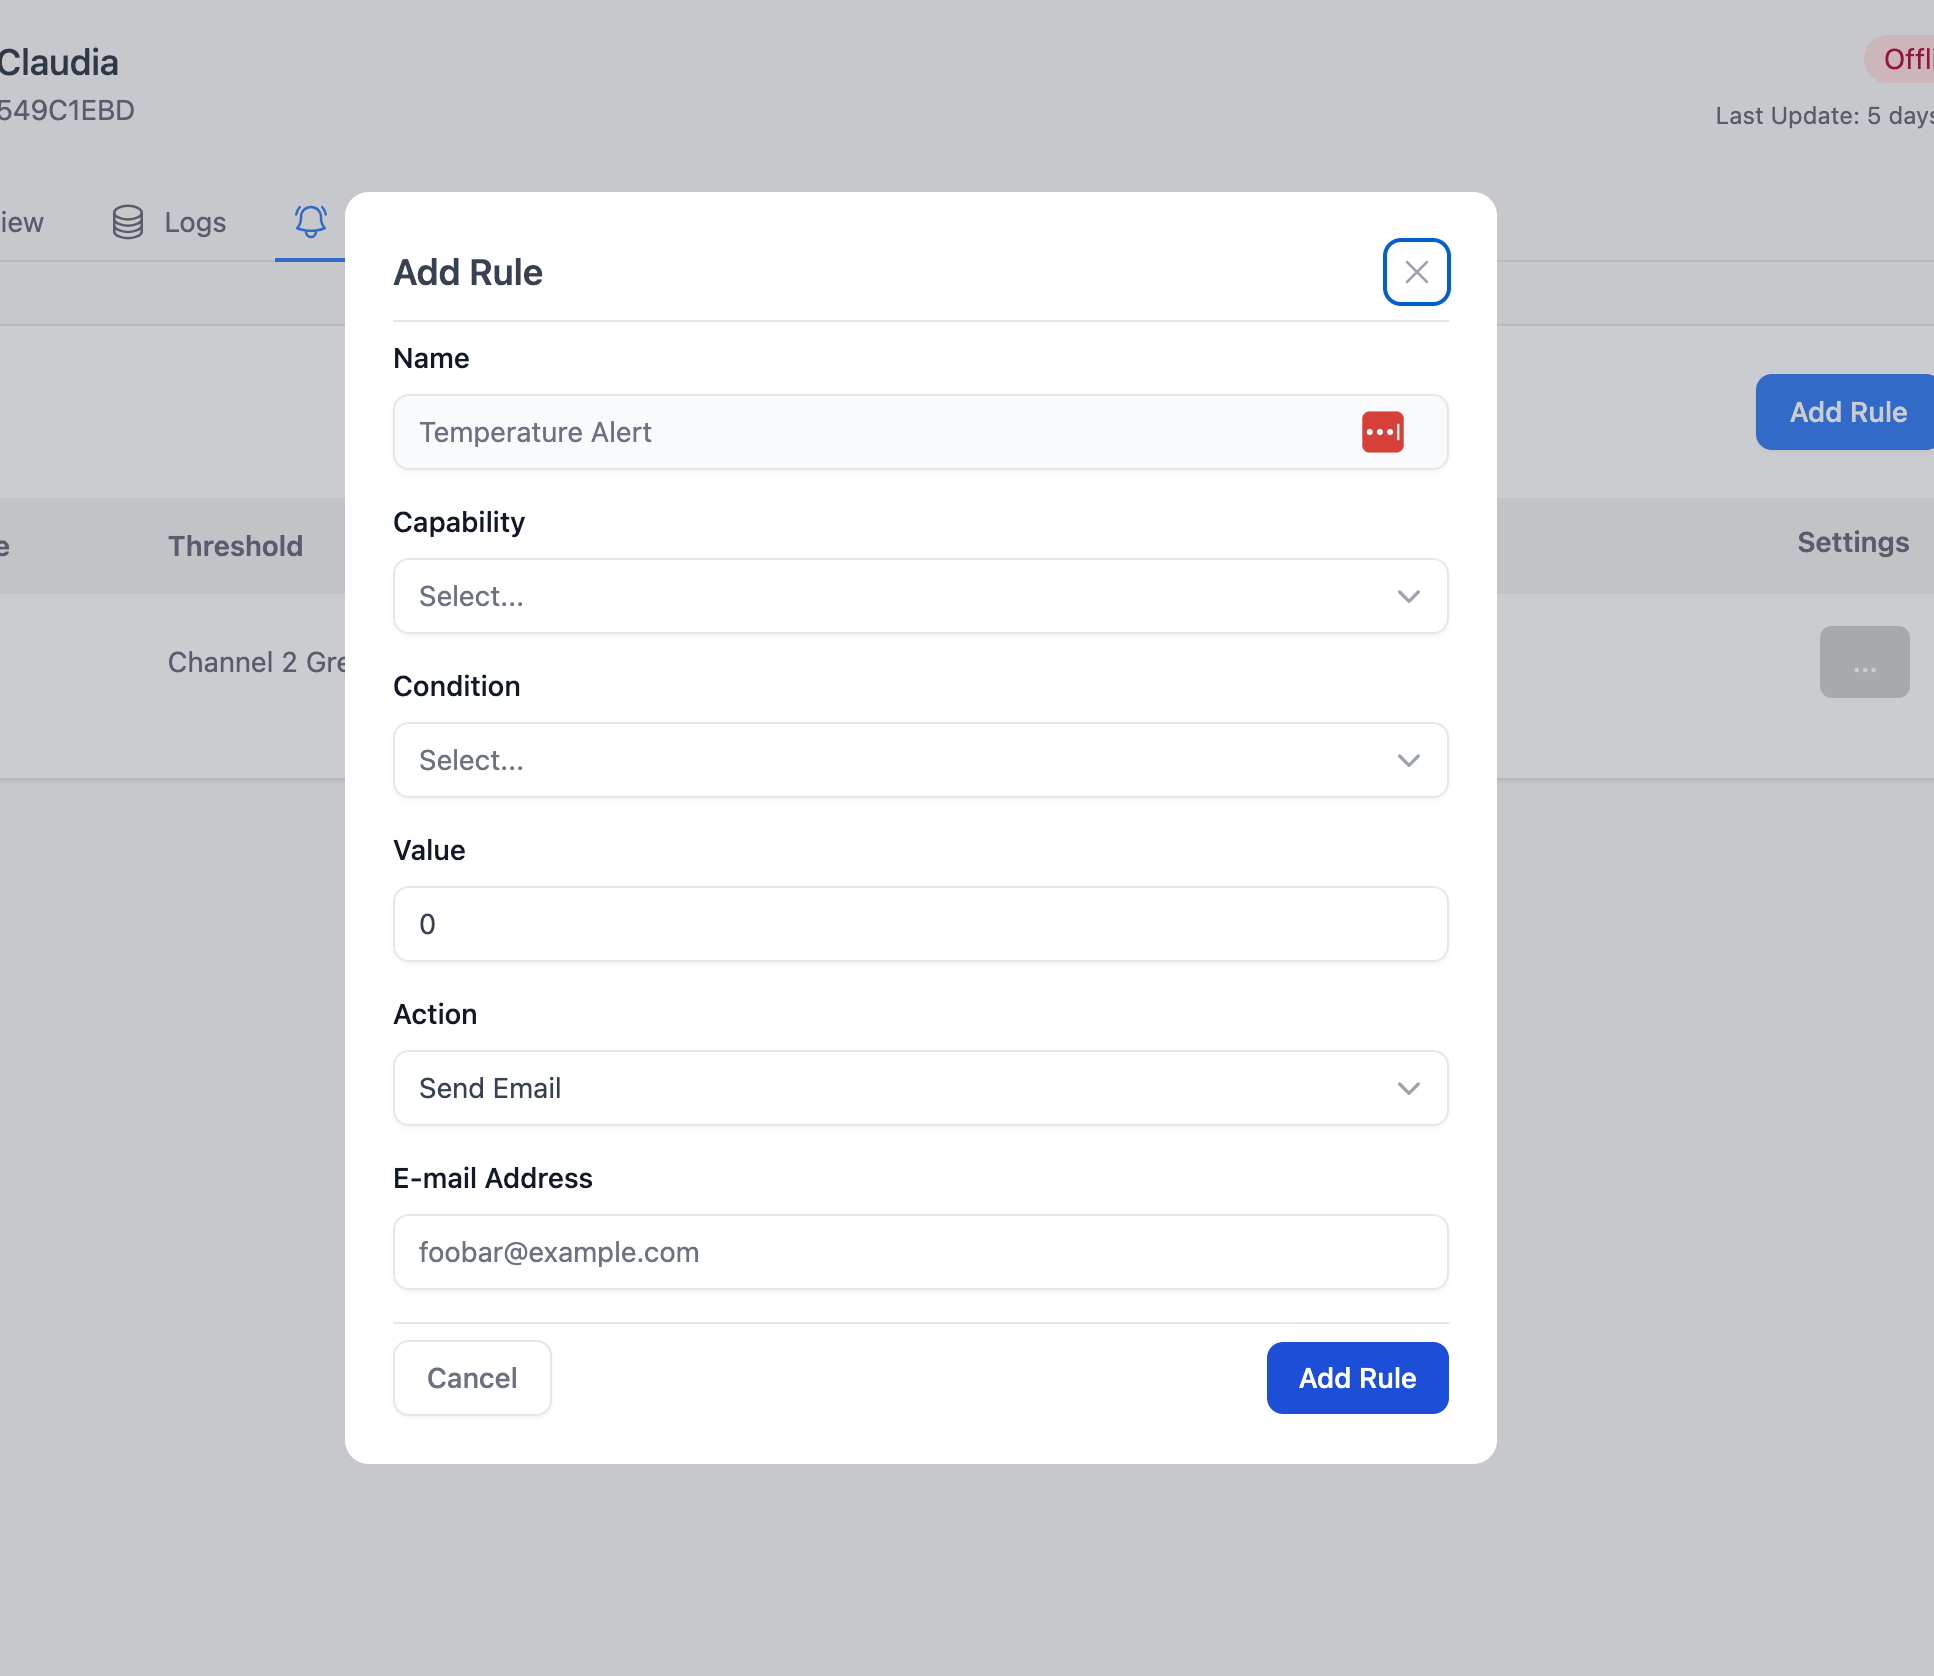
Rules Engine
NEW! Create rules and get email or web hook notifications base on sensor conditions.
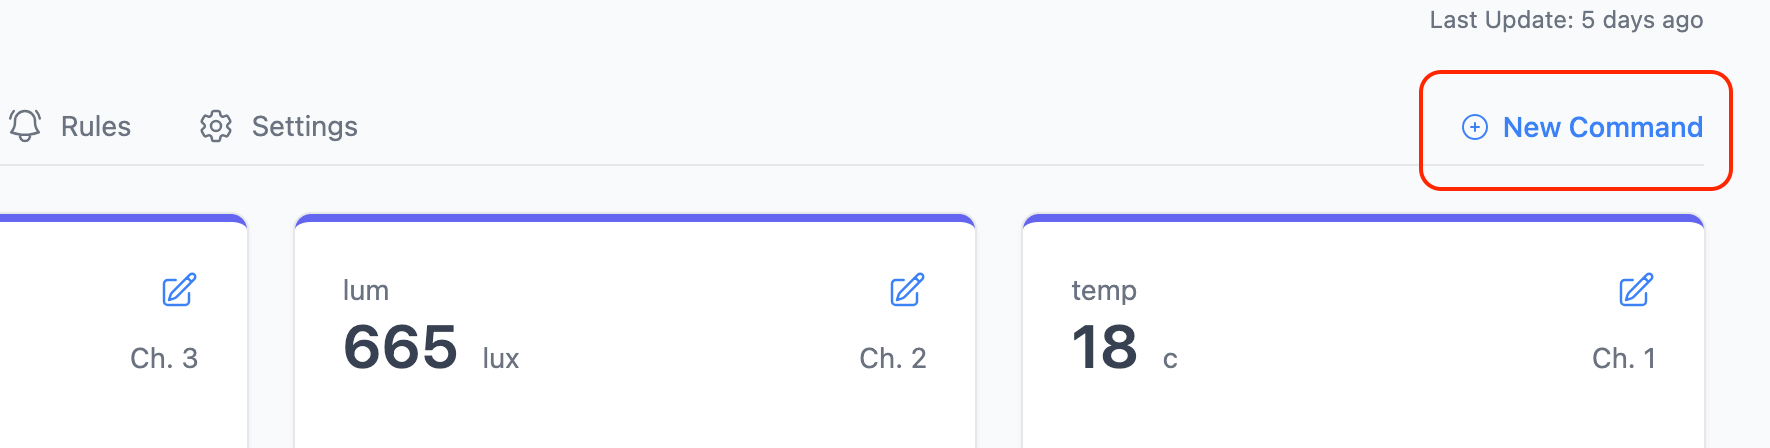
Ability to send binary commands to the device. A new +New Command button is now available under the device overview page.